(Portland's Transportation System Plan, May 2007)
In 1971, Oregon’s political leaders adopted state law ORS 366.514, which requires that cities and counties expend a minimum of one per cent of transportation revenues on bikeways and walkways, and that bikeways and walkways are included as part of roadway construction and reconstruction.
This strikes me as a reasonable place to begin, but the story of what happened thereafter is not entirely an unfamiliar one.
In 1972, the City organised a Bicycle Path Task Force, which produced the 1973 Bicycle Master Plan. By 1976, however, the City’s effort to implement the plan had stalled due to a lack of funding, support, and technical knowledge.
In 1978, the City Council appointed a citizens’ Bicycle Advisory Committee, which was charged with identifying and prioritising improvement plans for the proposed bicycle network. The following year, the Portland Bureau of Transportation initiated the Bicycle Program—one of the country’s first—with one full-time staff person. Over the next five years, the Bicycle Program created a bicycle map, developed bicycle parking code requirements, and installed about 250 bicycle racks and 40 lockers. The program also organised cycle events, such as bicycle-to-work days.
In 1982, the Bicycle Program identified 22 bicycle “corridors”, based on census data and travel-use patterns, and began an implementation process for bikeway improvements along these corridors.
In 1985, the Bicycle Program decided to discontinue holding events and instead placed more emphasis on bikeway corridor implementation schemes. It then finished several corridor projects. The program also initiated other corridor projects—such as NE Knott—but this plan necessitated the removal of on-street parking, and in the face of public opposition, it ultimately failed.
| Knott Street, Portland |
Finding the implementation of corridor projects to be very time-consuming and difficult, in 1988 the Bicycle Program altered the corridor process in favour of a more flexible process to make improvements on a district-by-district basis (there are seven districts in Portland).
In 1990, the Program implemented the Northeast Bikeway Plan that provided today’s signed bicycle routes.
In 1991, the Bicycle Program reversed an earlier decision not to hold events aimed at "encouraging more bicycle use". For example, it helped plan the 1993 and 1994 Burnside Bridge BikeFests, which attracted more than 10,000 participants.
In 1993, after many years of negotiation, the Council adopted the North Portland Bikeway Plan. Implementation of the plan was completed in the spring of 1995, except for North Willamette Boulevard, which was implemented later.
| North Willamette Boulevard, Portland |
As of January 1996, there were approximately 67 miles of separated in-road cycle lanes and 49 miles of multi-use trails in the City of Portland. There were also approximately 30 miles of signed routes through residential streets, including 10 miles of 'bicycle boulevards'. These existing 'bikeways' were widely dispersed and did not form a coherent network.
The modal share of trips made by bikes in Portland was "about two per cent".
Even so, just a couple of months earlier, Portland was selected by Bicycling Magazine as the most bicycle-friendly city in the United States.
* * *
In the spring of 1994, members of the City’s Bicycle Advisory Committee and staff from the Bicycle Program hosted a series of 12 two-hour public forums which were attended by over 600 people. At each of these forums, participants discussed the good and the not-so-good features of bicycling in Portland. The most prevalent view was that isolated cycle facilities may get all the kudos, but it was the lack of connections between these facilities that was the cause of the greatest frustration.
Also at this time, the Bicycle Program staff conducted a Bicycle Facility Preference Survey. Input from the public was compiled into the Bicycle Master Plan Phase One Report (June 1994), and used as the basis for the Bicycle Master Plan Preliminary Discussion Draft (March 1995).
In order to try to get more public input on the Preliminary Discussion Draft, the Bicycle Program team sent flyers to over 12,000 households, telling them what they were doing and giving them an opportunity to comment. Public forums were also announced in The Oregonian and in neighbourhood newsletters. All replies were considered, and most of them were incorporated into the Draft Bicycle Master Plan (August 1995).
The routes which made up the Recommended Bikeway Network were selected using the following process:
1. Bicycle Program staff reviewed and assimilated all previous plans for cycle schemes in Portland, going back over twenty years.
2. These were to be further enhanced by a system of 'bikeways' that met the following criteria:
• Connect cyclists to desired destinations, such as employment centres, commercial districts, transit stations, universities, schools, and recreational destinations;
• Link up to the regional bikeway system, thus providing continuity;
• Provide the most direct routes possible; and
• Provide a bikeway approximately every half mile.
3. On those streets where it was intended that cycle lanes would be installed, staff collected the following information:
• Traffic volume (average daily traffic)
• Street width
• Number of existing traffic lanes
• Availability of parking, parking usage, and the need for on-street parking
4. For those streets to be converted to 'bicycle boulevards', staff collected the following information:
• Traffic volume (average daily traffic)The City of Portland Bicycle Master Plan was finally adopted in the autumn of 1996, following a consultation process which had lasted over two years. The purpose of the plan was the establishment of a 20-year framework for changes that would substantially improve the bicycling environment in Portland.
• Street width
• Availability of parking and parking usage
• Difficulty crossing major intersections
• Surface quality
5. When the most direct route between desired destinations occurred on streets where constraints were known to exist, staff surveyed alternative parallel routes.
Within 5 years, it was planned that:
• 3% of all journeys would be undertaken by bicycle (5% for Inner Portland);Within 10 years, it was planned that:
• there would not be a corresponding rise in the number of bicycle - motor vehicle crashes; and
• 40% of the network would be completed (equating to approximately 250 bikeway miles);
• 6% of all journeys would be undertaken by bicycle (10% for Inner Portland);Within 20 years, it was planned that:
• the number of bicycle - motor vehicle crashes would come down by 10%; and
• 60% of the network would be completed (equating to approximately 380 bikeway miles);
• 10% of all journeys would be undertaken by bicycle (15% for Inner Portland);
• the number of bicycle - motor vehicle crashes would come down by 20%; and
• 100% of the network would be completed (equating to approximately 670 bikeway miles);
* * *
In 2006, Roger Geller, the Bicycle Coordinator at the Portland Office of Transportation, published an article entitled Four Types of Cyclists (updated in 2009).
Based on their relationship to the bicycle as a means of transport, Geller placed the residents of Portland into one of the four following groups: The Strong and Fearless, The Enthused and Confident, The Interested but Concerned, and The No Way No How.
The Strong and Fearless make up maybe just 1% of the population. These are the people for whom riding a bike is a strong part of their identity.
Approximately 1% of the commuting population in cities across America identified the bicycle as their primary means of transportation, and conditions in these cities are generally not conducive to bicycling. Indeed, most of the cycle commuters in the States ride bikes in the absence of any identifiable facilities.
This is the essence of The Strong and Fearless, that they will ride a bicycle regardless of the road conditions. Under the worst of conditions—as is found in most American cities—they are generally the only ones riding.
The Enthused and Confident are those who have been attracted to use a bicycle for utility purposes by "the significant advances the city [of Portland] has made in developing its bikeway network and supporting infrastructure over the past 16 years [i.e. since about 1990]."
| Hawthorne Bridge, one of the "bicycle-friendly" bridges in Portland which saw more than a 300% increase in daily bicycle trips between the early 1990s and 2006. |
In developing an amenable cycling environment, the authorities in Portland have been constrained by "tiny budgets and limited designs", but even so, they have done as much as they can to make bicycling convenient, safe, and comfortable.
We're still talking about a "bare bones infrastructure" here, but this notwithstanding, the authorities have been able to attract a reasonably high proportion of residents to bicycling. Compared to the early years, when Portland’s bicycle systems were either non-existent or less mature than today, this represents a significant positive change.
The case is, the cycling environment in Portland is of sufficient quality to attract a significant subset of people to bicycling. It is a subset that requires only minimal facilities, and whom Roger Geller describes as The Enthused and Confident.
| Image courtesy of Portland Bureau of Transportation |
Pretty much all of the growth in the number of trips made by bike in Portland is because this demographic of cyclists has responded well to the city's formative attempts at developing an amenable cycling environment.
A much larger demographic, representing the vast majority of Portland’s citizens, are The Interested but Concerned. This group is defined not just by who they are (as revealed by the available data), but also by who they are not. They are not regularly using a bicycle, but if things were different then probably they would be prepared to cycle much more often.
These are the people who, in survey after survey, identify fear for their safety as their primary reason for not riding. It is not that they are disinterested in bicycling; it is simply that they will only ride where they feel safe, and where bicycling makes sense.
They are curious about bicycling, certainly. They are hearing messages from a wide variety of sources about how much easier it is becoming to ride a bicycle in Portland, about how bicycling is booming in the city, about an emerging “bicycle culture”, about Portland being a “bicycle-friendly” city, and about the need for people to lead more active lives. They like the idea of riding a bicycle, remembering back to their childhood, or to the ride they took last summer on the Springwater trail, and they would like to be able to ride more. But they are held back by a fear of the road conditions.
Perhaps one-third of the city’s population falls into the last category, which is described as The No Way No How group. These people have had exceptionally limited exposure to bicycling throughout their lives, and do not have much inclination to change this.
* * *
In July 2011, Professor Jennifer Dill of Portland State University conducted a random phone survey as part of a study on bicycling behaviour.
The objective of Professor Dill's research was to look at Geller's Four Types, with a view either to confirm its validity, or to find a different way to describe Portland's cyclists and non-cyclists. She also sought to identify how to increase levels of utility cycling. As Jonathan Maus from bikeportland.org explained: "She wanted to understand the various types of riders better, so that planners and engineers could tailor solutions to their needs and ultimately increase bike usage."
Roger Geller makes the point that understanding the differing needs of the four general categories of transportation cyclists "best precedes a discussion of bikeway treatments". He is absolutely right, of course: you do have to know your market.
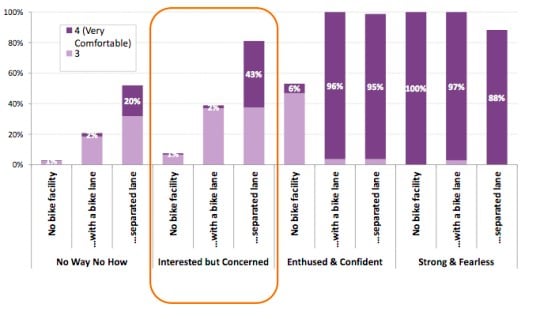
Regarding the bar-chart shown above, one of the things which stood out for me is that the better the quality of the cycle facility, the less comfortable The Strong and Fearless become (which probably explains a lot). Another thing is that in order for the authorities to encourage The Interested but Concerned to cycle regularly, they would need to put a lot of work in. And the last thing is that the distinction between The Interested but Concerned and The No Way No How is not as clear cut as I was expecting. To quote Professor Dill, it likely incorporates "quite a bit of blurring".
This research goes some way to confirming Geller's postulation that The Enthused and Confident are somewhat comfortable cycling in the absence of any bike facilities, and The Interested but Concerned are not at all comfortable cycling in the absence of separate bike facilities.
So how did they do in Portland?
To remind you, the target was for 3% of all journeys to be undertaken by bicycle by 2001, 6% of all journeys by 2006, and 10% by 2016.
A summary of the 2012 Bicycle Count is as follows:
• Since the counts began in 2000/2001, the overall trend in bicycle traffic is up 211 per cent—more than a tripling in use.
• 2012 bicycle counts showed a growth of 3.3 per cent on the previous year.
• Since annual counts began, bicycle traffic on Portland’s five principal bicycle-friendly bridges (Broadway, Steel, Burnside, Morrison and Hawthorne) showed the highest number of bicycle trips.
• Bicycle counts showed a one year decline in both NW and SW Portland.
• Helmet use is highest in SW Portland (90 per cent) and lowest in East Portland (63 per cent).
• Helmet use is more prevalent amongst female riders (86 per cent) than amongst male riders (77 per cent).
• Female riders represented 31 per cent of bicyclists city-wide, remaining essentially unchanged since 2003.
The Existing Conditions Report dated 2007 noted that reported crashes between bicycles and motor vehicles remained static between 1996 and 2005. However, based on a significantly decreasing bicycle crash rate, the report concluded that conditions for bicycling are safer today than in 1996.
This is not entirely unreasonable, actually. An article from The Economist dated September 2011 noted that in five of the past ten years, there have been no cycling fatalities in Portland.
When it has come to increasing cycling's modal share and making cycling safer, the authorities have been there or thereabouts, if a little bit behind the curve somewhat. However, when it has come to the development of a coherent cycle network, they have been a long way off-target. As you may recall, in 2001 there should have been 250 'bikeway' miles, and in 2006 there should have been 380 'bikeway' miles.
In 1996, there were:
67 miles of separated in-roadway bike lanes
49 miles of multi-use trails
10 miles of 'bicycle boulevards'
20 miles of signed routes through residential streets
Total: 146 miles
In 2006, there were:
166 miles of separated in-roadway bike lanes
68 miles multi-use trails
30 miles of 'bicycle boulevards'
26 miles of signed routes through residential streets
Total: 290 miles
In 2010, there were:
176 miles of separated in-roadway bike lanes
75 miles of multi-use trails
30 miles of 'bicycle boulevards'
28 miles of signed routes through residential streets
Total: 309 miles
The project was beginning to fall off the rails. There was only one thing to be done about it, therefore ...

And so, in 2030, there will be:
490 miles of separated in-roadway bike lanes
139 miles of multi-use trails
286 miles of 'bicycle boulevards'
0 miles of signed routes through residential streets
Total: 962 miles
 |
| Image from Professor Jennifer Dill's presentation to the 2012 Velo-City conference in Vancouver, courtesy of bikeportland.org |
Regarding the bar-chart shown above, one of the things which stood out for me is that the better the quality of the cycle facility, the less comfortable The Strong and Fearless become (which probably explains a lot). Another thing is that in order for the authorities to encourage The Interested but Concerned to cycle regularly, they would need to put a lot of work in. And the last thing is that the distinction between The Interested but Concerned and The No Way No How is not as clear cut as I was expecting. To quote Professor Dill, it likely incorporates "quite a bit of blurring".
This research goes some way to confirming Geller's postulation that The Enthused and Confident are somewhat comfortable cycling in the absence of any bike facilities, and The Interested but Concerned are not at all comfortable cycling in the absence of separate bike facilities.
* * *
So how did they do in Portland?
To remind you, the target was for 3% of all journeys to be undertaken by bicycle by 2001, 6% of all journeys by 2006, and 10% by 2016.
Calendar year
|
1990
| 2000 | 2005 | 2006 | 2007 | 2008 | 2009 | 2010 | 2011 |
|---|---|---|---|---|---|---|---|---|---|
| Portland bike share |
1.2%
|
1.8%
|
3.5%
|
4.2%
|
3.9%
|
6.0%
|
5.8%
|
6.0%
|
6.3%
|
| National bike share |
0.41%
|
0.38%
|
0.40%
|
0.45%
|
0.48%
|
0.55%
|
0.55%
|
0.53%
|
0.56%
|
A summary of the 2012 Bicycle Count is as follows:
• Since the counts began in 2000/2001, the overall trend in bicycle traffic is up 211 per cent—more than a tripling in use.
• 2012 bicycle counts showed a growth of 3.3 per cent on the previous year.
• Since annual counts began, bicycle traffic on Portland’s five principal bicycle-friendly bridges (Broadway, Steel, Burnside, Morrison and Hawthorne) showed the highest number of bicycle trips.
• Bicycle counts showed a one year decline in both NW and SW Portland.
• Helmet use is highest in SW Portland (90 per cent) and lowest in East Portland (63 per cent).
 |
| On average, 80% of all cyclists in Portland wear helmets (Image courtesy of Natural Vitality Sports) |
• Female riders represented 31 per cent of bicyclists city-wide, remaining essentially unchanged since 2003.
The Existing Conditions Report dated 2007 noted that reported crashes between bicycles and motor vehicles remained static between 1996 and 2005. However, based on a significantly decreasing bicycle crash rate, the report concluded that conditions for bicycling are safer today than in 1996.
This is not entirely unreasonable, actually. An article from The Economist dated September 2011 noted that in five of the past ten years, there have been no cycling fatalities in Portland.
| Ladd Avenue: a bicycle boulevard / neighbourhood greenway in Portland |
When it has come to increasing cycling's modal share and making cycling safer, the authorities have been there or thereabouts, if a little bit behind the curve somewhat. However, when it has come to the development of a coherent cycle network, they have been a long way off-target. As you may recall, in 2001 there should have been 250 'bikeway' miles, and in 2006 there should have been 380 'bikeway' miles.
In 1996, there were:
67 miles of separated in-roadway bike lanes
49 miles of multi-use trails
10 miles of 'bicycle boulevards'
20 miles of signed routes through residential streets
Total: 146 miles
In 2006, there were:
166 miles of separated in-roadway bike lanes
68 miles multi-use trails
30 miles of 'bicycle boulevards'
26 miles of signed routes through residential streets
Total: 290 miles
In 2010, there were:
176 miles of separated in-roadway bike lanes
75 miles of multi-use trails
30 miles of 'bicycle boulevards'
28 miles of signed routes through residential streets
Total: 309 miles
The project was beginning to fall off the rails. There was only one thing to be done about it, therefore ...
And so, in 2030, there will be:
490 miles of separated in-roadway bike lanes
139 miles of multi-use trails
286 miles of 'bicycle boulevards'
0 miles of signed routes through residential streets
Total: 962 miles
* * *
It was The Strong and Fearless and The Enthused and Confident cyclists who helped shape the 1996 Bicycle Master Plan. That plan’s focus was for bicycle lanes on arterial streets, which reflected the thinking prevalent at the time.
Coupled with incremental investments on key bridges, the increasing presence of bike lanes helped to raise the profile of cycling. People who hadn't thought to ride a bike for utility purposes began to see that if they started cycling, the city authorities would be taking their safety seriously. This created a virtuous circle.
Today this group of “Enthused and Confident” riders account for perhaps six to ten percent of the population in Portland, and they are largely responsible for the increase in bicycle use over recent years.
As the Chief Executive Officer of the ETA, Andrew Davis, once told Radio 5 Live: "It only needs people on the margin [to begin with]: the people who are more likely to do it, to encourage them. Of course there are people who won't do it whatever, but if enough people do it, it does make a change."
All in all, the photos above are variously described on the network map using four different colours.
In 1975, just 200 cyclists a day were recorded as using Hawthorne Bridge. On September 25 last year, the number of bike trips over this bridge was counted at 8,305 (i.e. more than 4,000 cyclists).
Impressive though this sounds, if the authorities in Portland could turn back the clock, would they be better advised to do certain things differently the second time around?
As we have already seen, the 1996 Bicycle Master Plan was largely informed by the views of existing cyclists. They knew what they wanted, and presumably as well they knew that like-minded people would be attracted to cycling, and that cycling would be made safer, if the authorities addressed certain key issues.
However, even now, the network still has gaps in it. The authorities would do well to understand the value of getting the network to function, even if it just to a minimum level to begin with. Remember, in the case of Portland, the City authorities are under a legal obligation to include bikeways as part of any roadway reconstruction. So it ought not to have mattered that bits of would been complete crap in the early days. The important thing was that the network was established, and made to work (if only for The Strong and Fearless and The Enthused and Confident).
Roger Geller remarks that one of the primary differences between Portland and the bicycle-friendly cities of Denmark, the Netherlands, Germany, and so on, is that in those cities cycling is safer and more comfortable. This is borne out by the comparative crash data, he says, by conversations with officials from those countries, and by government policy documents that place a premium on designs that maximise the safety and comfort of bicycling.
Safety and comfort have become fundamental to expanding cycling in these countries, Geller continues, in large part because the authorities need to appeal to their Interested but Concerned populations. The European approach recognises that, in the absence of good quality infrastructure, only the “cyclists” will cycle. If cycling is to be universally adopted as a means of transportation, then the concerns of the majority must be addressed. In this typology, that majority is the Interested but Concerned.
This is absolutely correct. Safety and comfort are indeed basic preconditions of mass cycling. But more than this, if you want to go all the way, it seems to be necessary to create an environment which makes bicycling feel that it is a dignified way to travel.
Coupled with incremental investments on key bridges, the increasing presence of bike lanes helped to raise the profile of cycling. People who hadn't thought to ride a bike for utility purposes began to see that if they started cycling, the city authorities would be taking their safety seriously. This created a virtuous circle.
Today this group of “Enthused and Confident” riders account for perhaps six to ten percent of the population in Portland, and they are largely responsible for the increase in bicycle use over recent years.
London's enthused and confident cyclists. Video by ibikelondon.
As the Chief Executive Officer of the ETA, Andrew Davis, once told Radio 5 Live: "It only needs people on the margin [to begin with]: the people who are more likely to do it, to encourage them. Of course there are people who won't do it whatever, but if enough people do it, it does make a change."
* * *
Cycling: the way ahead for towns and cities talks about how the development of a bare-bones infrastructure would encourage "the mass of non-cyclists who are most likely to take up cycling again", and in the case of Portland, here we have the proof of it.
Cycling: the way ahead was published a few years after Portland launched its Bicycle Master Plan, and I wonder how different things might have been there if they had been aware of all of its recommendations.
They were so close: they thought in terms of a network; they planned the network; they studied the feasibility of the network; they had a clear idea of who would actually use the network. But either they didn't accept, or they didn't know about, the "prudence" of "introducing" the network to a minimum level of functioning.
Even then they almost got it.
The map below shows the latest version of the cycle network map.
 |
| Map image courtesy of PELA (view larger map) |
The routes marked with the dotted red line show a "DIFFICULT CONNECTION in areas with higher speeds and/or volumes, combined with narrow lane widths or other problems for cyclists."
This is one feature which does not appear on any network map that I have seen from the UK, which is surprising actually, because according to The Ranty Highwayman:
Following the famous Gorringe vs Calderdale case, it has been held that road users must be responsible for their own actions - "taking the road as they find it" (unless there was a clear design fault, of course). The essence of this case is that Mrs Gorringe drove too fast towards the crest of a hill she didn't know was ahead and then braked sharply, hitting a bus. She contended that Calderdale Metropolitan Council was at fault not not painting a "SLOW" sign on the road. The case went all the way to the House of Lords where Calderdale were judged not at fault and Mrs Gorringe had a responsibility for her own actions.
I will talk about this another time ...
* * *
One thing you will see in the UK, however, is a route which is marked in different colours on the map, even though it goes along the same road.
On this section you will be sharing the road-space with other traffic: the levels of traffic will be fairly low. There will be awareness-raising markers on the carriageway, and there will also be directional signs to guide you.
On this section you will be sharing the road-space with other traffic: the levels of traffic will be moderate or even fairly high. The carriageway will have a wider outside lane.
This section is closed to motor traffic, and this section has a bike lane. This section goes through a park, and this section is shared with pedestrians.
And so it goes on, as if map-reading and wayfinding weren't already difficult enough as it is.
So I decided to take a closer look at the route shown above. I am heading south to north ...
| 28th Avenue (near the junction with Steele Street) |
| 28th Avenue (near the junction with Holgate Boulevard) |
| Gladstone Street |
| 26th Avenue (near the junction with Francis Street) |
| 26th Avenue (near the junction with Brooklyn Street) |
| 26th Avenue (at the junction with Taggart Street) |
| 26th Avenue (at the junction with Ivon Street) |
| 27th Avenue (at the junction with Hawthorne Boulevard) |
| 27th Avenue (at the junction with Washington Street) |
| 28th Avenue (at the junction with Couch Street) |
| 28th Avenue (at the junction with Oregon Street) |
| 28th Avenue (on the bridge over the Banfield Expressway) |
| 28th Avenue (near the junction with Weidler Street) |
| 28th Avenue (at the junction with Broadway) |
All in all, the photos above are variously described on the network map using four different colours.
* * *
In 1975, just 200 cyclists a day were recorded as using Hawthorne Bridge. On September 25 last year, the number of bike trips over this bridge was counted at 8,305 (i.e. more than 4,000 cyclists).
Impressive though this sounds, if the authorities in Portland could turn back the clock, would they be better advised to do certain things differently the second time around?
As we have already seen, the 1996 Bicycle Master Plan was largely informed by the views of existing cyclists. They knew what they wanted, and presumably as well they knew that like-minded people would be attracted to cycling, and that cycling would be made safer, if the authorities addressed certain key issues.
However, even now, the network still has gaps in it. The authorities would do well to understand the value of getting the network to function, even if it just to a minimum level to begin with. Remember, in the case of Portland, the City authorities are under a legal obligation to include bikeways as part of any roadway reconstruction. So it ought not to have mattered that bits of would been complete crap in the early days. The important thing was that the network was established, and made to work (if only for The Strong and Fearless and The Enthused and Confident).
* * *
Going forward, the strategy outlined above still has a way to go yet before it runs its course. A much denser network is being planned, which puts all residents (pretty much) within about a quarter-of-a-mile of a bikeway.
My instinct is that developing a network which can be used by The S & F and The E & C may get you to a modal share of about 10-12%, say, on a fine day, and assuming those 'soft' measures which were implemented were done well. But if you're serious about mass cycling, at some point you need to push on to that final step.
My instinct is that developing a network which can be used by The S & F and The E & C may get you to a modal share of about 10-12%, say, on a fine day, and assuming those 'soft' measures which were implemented were done well. But if you're serious about mass cycling, at some point you need to push on to that final step.
Safety and comfort have become fundamental to expanding cycling in these countries, Geller continues, in large part because the authorities need to appeal to their Interested but Concerned populations. The European approach recognises that, in the absence of good quality infrastructure, only the “cyclists” will cycle. If cycling is to be universally adopted as a means of transportation, then the concerns of the majority must be addressed. In this typology, that majority is the Interested but Concerned.
This is absolutely correct. Safety and comfort are indeed basic preconditions of mass cycling. But more than this, if you want to go all the way, it seems to be necessary to create an environment which makes bicycling feel that it is a dignified way to travel.
No comments:
Post a Comment